Freezing Saddles Scoreboard backend "soft launch"
Our Community › Forums › Freezing Saddles Winter Riding Competition › Freezing Saddles Scoreboard backend "soft launch"
- This topic has 211 replies, 38 voices, and was last updated 11 years, 5 months ago by
hozn.
-
AuthorPosts
-
January 16, 2014 at 1:42 pm #991380
dcv
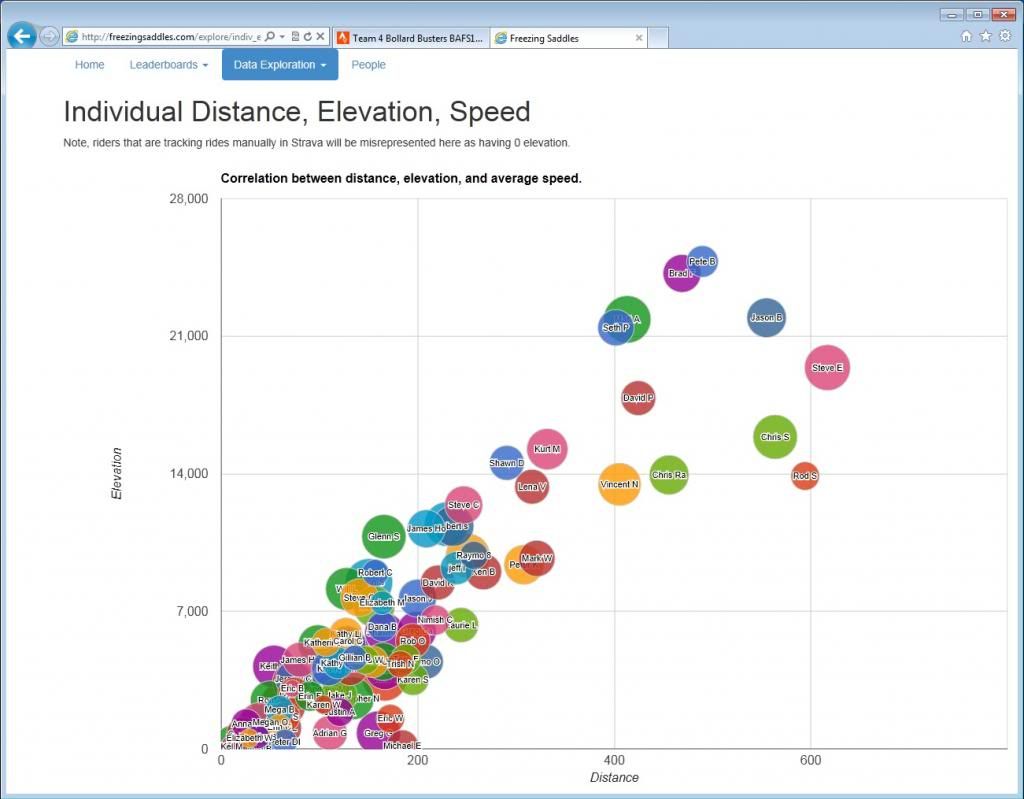
ParticipantI love this chart, reminds me of a star comparsion chart. Hans – can you animate this starting from Jan 1? That would be so cool.
 January 16, 2014 at 2:35 pm #991385
Rod Smith
Participantred dwarf
January 16, 2014 at 3:25 pm #991398hozn
Participant@dcv 74910 wrote:
I love this chart, reminds me of a star comparsion chart. Hans – can you animate this starting from Jan 1? That would be so cool.
Thanks! I love that chart too. In general, I think data visualization is fascinating and appreciated the opportunity to deviate beyond a bar chart for this one
") I don’t know if Google Charts makes it possible to animate, but I agree that would be awesome. I will look into it.January 17, 2014 at 3:08 am #991473
I don’t know if Google Charts makes it possible to animate, but I agree that would be awesome. I will look into it.January 17, 2014 at 3:08 am #991473Vicegrip
Participant@dkel 74785 wrote:
I put on both gloves, then start my phone and Strava with my nose. Yes, I trained my iPhone 5s to recognize my nose print.
Ok, not really.
I answer my I phone by swiping it with my nose. Too lazy to stop riding and pull a glove off.
January 17, 2014 at 11:11 am #991482dbb
Participant@dcv 74910 wrote:
I love this chart, reminds me of a star comparsion chart. Hans – can you animate this starting from Jan 1? That would be so cool.
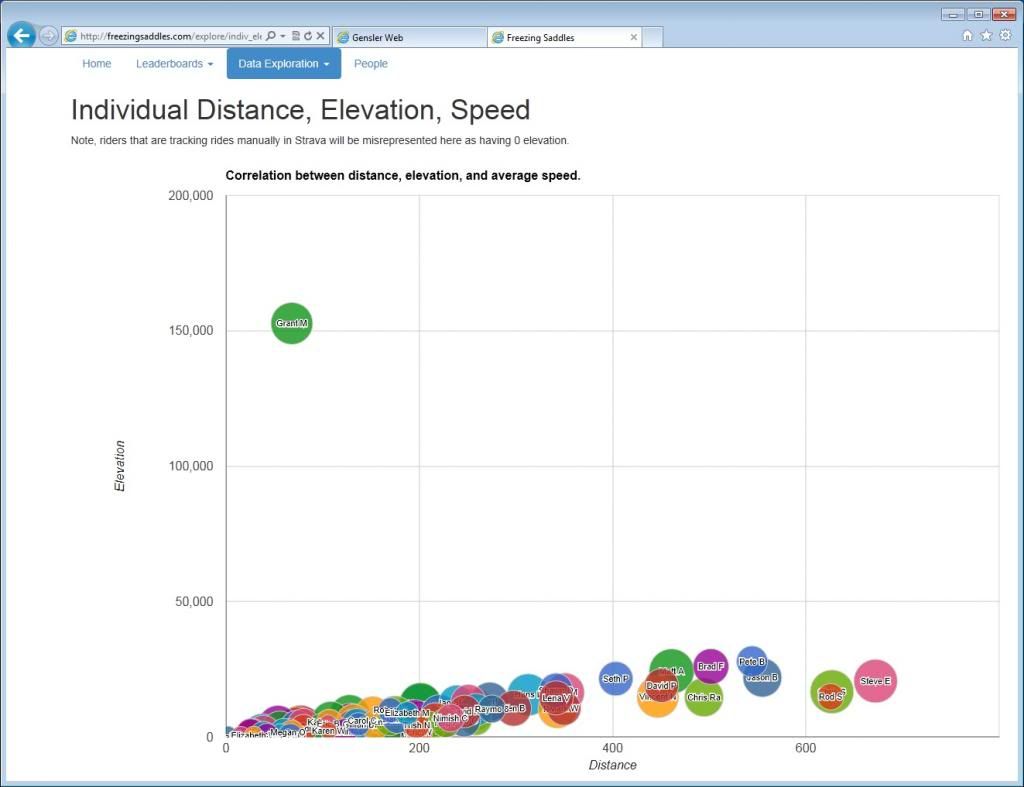
It appears Dirt should reach the summit of Mt. Everest soon.
January 17, 2014 at 11:53 am #991484MattAune
ParticipantHans, do you pull daily precipitation totals? A chart for number of riders vs. daily precipitation would be one I would like to see.
January 17, 2014 at 2:58 pm #991498ParticipantDasgeh, whats going on here?
 January 17, 2014 at 3:13 pm #991501Participant
Been getting high on the bike again?
January 17, 2014 at 3:19 pm #991502Participanthttp://www.strava.com/activities/105932356
-2,084.3% grade sounds seriously scary. But the 40k feet of elevation gain in .2 miles sounds like an intense climb.
January 17, 2014 at 3:35 pm #991504ParticipantNow that’s a KOM!
January 17, 2014 at 3:59 pm #991513cyclingfool
ParticipantThis must be what happens when you take a GPS on one of these:
[ATTACH=CONFIG]4496[/ATTACH]
Which makes me think this activity should have been tagged #NOBAFS.
It’s funny that Strava lets that kind of ridiculous elevation data through w/o question b/c it’s from a unit w/ a barometric altimeter, yet its algorithms decrease my elevation gain over one of my standard AM commute routes of around 7.5 miles to zero. (track from an eTrex 20 track w/o altimeter) I mean, that route is flat, but there are overpasses, bridges, and a couple small hills, like 15th St from the Tidal Basin towards Independence along that route, so gain is certainly not zero. Oddly enough, the exact same route recorded on my phone yields 75-100 ft elevation gain after it’s processed by Strava.
January 17, 2014 at 4:09 pm #991515americancyclo
Participant@hozn 74930 wrote:
Thanks! I love that chart too. In general, I think data visualization is fascinating and appreciated the opportunity to deviate beyond a bar chart for this one
I don’t know if Google Charts makes it possible to animate, but I agree that would be awesome. I will look into it.Google has motion charts!
January 17, 2014 at 4:31 pm #991517Mikey
Participanthozn, thanks for all of your hard work.
Not to nit-pick, but I noticed that my score is off 17 days +226 and I have 386 points. Shouldn’t that be 396? Did I screw up an entry somewhere?
January 17, 2014 at 4:35 pm #991518rcannon100
ParticipantI think we are going to have to start charging $1 for every request to Honz. We could make him a very rich man.
January 17, 2014 at 4:40 pm #991520Participant@rcannon100 75066 wrote:
I think we are going to have to start charging $1 for every request to Honz. We could make him a very rich man.
Wouldn’t that go to buy beer at the awards ceremony?
On a more serious note (yeah sure), I have been trying to come up with a completely off the wall request to make this even more pointless.
-
AuthorPosts
- You must be logged in to reply to this topic.